Functional Data Analysis for generation of building energy demand profiles
No matter how efficient a building, it is occupants that drive energy consumption - whether for comfort or device operation. Building energy simulation offers a means to assess different options without requiring costly in-situ tests, provided the simulation demonstrably replicates the building performance. This proves to be difficult not only pre-construction but even for operational demand, in part because individual and collective occupant behaviour is difficult to quantify. In addition, a key assumption is that the internal loads are in some way related to the activity that takes place in a building zone. This is problematic both because the definition of activity is indeterminate and because building sub-metering strategies rarely align with the specified activities. A new approach is required.
But a model must not only be able to generate good estimates of the key performance indicators with a measure of the uncertainty but must also be able to assimilate data, be able to simulate operational change and be straightforward to use. There is a rapidly increasing pool of monitored data at increasing time and spatial resolutions for non-domestic buildings. This increased monitoring generates a real opportunity for gaining an in-depth understanding of the nature of occupant-related internal loads. The requirement for a model to be able to assimilate these data make a data-centric model a natural choice.
A Functional Data Analysis approach
A new data-centric bottom-up model has been developed for the definition of occupant-related building internal loads (plug loads and lighting) for input into building energy simulation.
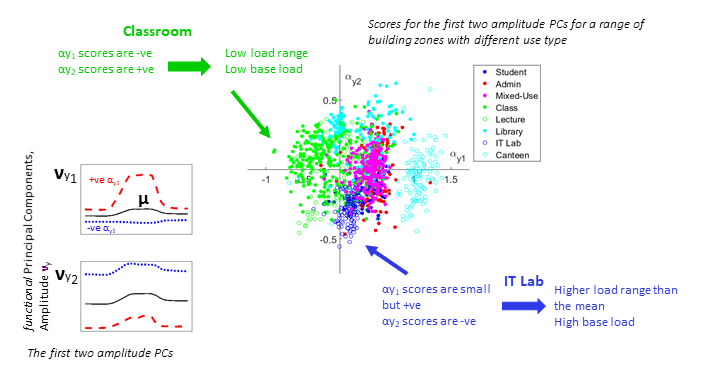
This can be done for different zones and different types of day - for example weekday and weekend – and an annual stochastic demand profile can be built up for use as input into building energy simulation. The beauty of this approach is that it is not necessary to analyse each building independently; given a set of PCs any new data can be projected onto these PCs in order to generate scores that may be compared directly against existing data samples and used to generate sample data.
Does zone ‘activity’ determine internal loads?
A key assumption in simulation of non-domestic buildings is that the internal loads are directly related to the activity that takes place in a building zone. This is problematic both because the definition of activity is indeterminate and because building sub-metering strategies rarely align with the specified activities. The transformation of each data sample into a set of discrete values means that statistical techniques can be used for analysis of the similarities and differences between the data samples. Specifically, clustering of the scores - whereby the scores for different zones are grouped together depending on how similar they are - has been used to explore whether the zones that have similar score distributions also have similar nominal activities. The specific technique used is hierarchical clustering which starts by pairing the zones that are the most similar and then iteratively adding in the next closest zones. The dendrogram shows the result of clustering the scores for the plug loads; also shown are the zone nominal activities.
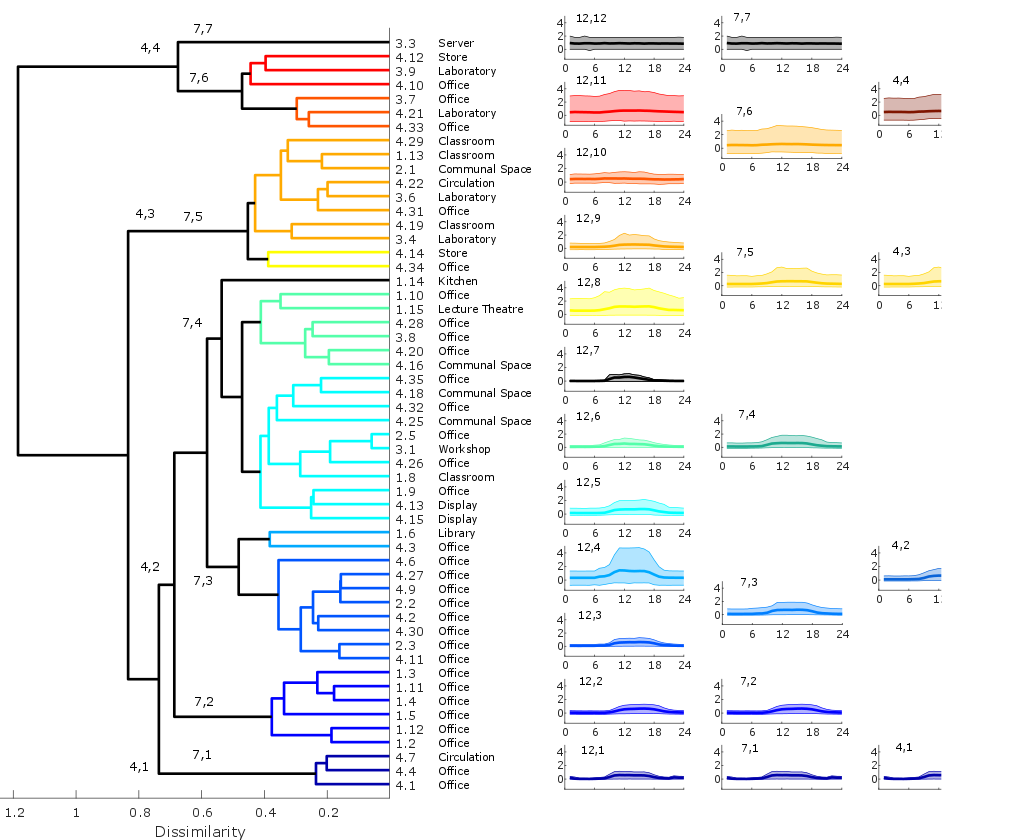
For plug loads the similarity in demand profiles between different building zones is more related to the variability of the data than the nominal zone activity. For lighting loads a similar approach reveals that zones within the same building are more similar than zones with the same nominal activity from different buildings. This is likely due to the different buildings having different lighting control strategies.
Deconstruction of the data leads to the conclusion that activity per se is not a good indicator of internal loads. Instead, for plug loads it is the expected variability of the data that is important, whereas for lighting the control strategy of each individual building zone defines the stochasticity of the demand.
A practical tool
The model has been developed into a practical tool for generation of plug loads and lighting demand in the form of annual hourly time histories of internal load that can be input directly into a building energy simulation. As a design tool the modeller can select an expected level of variability in demand and use an estimated base load and load range to generate synthetic demand profiles. Separate tools are available for plug loads and lighting; for plug loads the variability option ranges from 1 – regular weekday demand – to 4 – irregular demand. For lighting loads there are 5 levels of variability corresponding to different types of lighting control and occupancy pattern. The design tool uses as its basis the PCs and scores calculated for the 4 buildings used in the clustering study. The variability options reflect the optimum number of clusters derived from a consideration of how samples generated from the clustered data compare against the monitored data in terms of the key performance indicators.
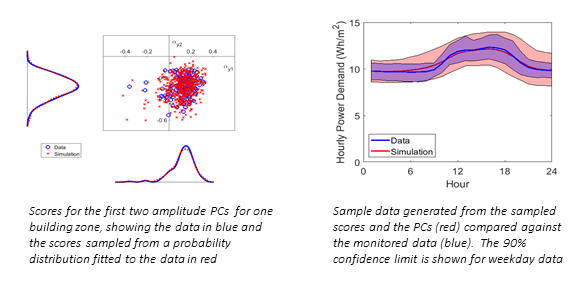
The beauty of this approach is that if monitored data are available - for example when optimising retrofit designs - the data can be used to generate synthetic time histories that encompass observed demand but can also be modified to account for operational change - a reduction in minimum daily demand for example. The data are projected onto the existing set of PCs to extract the scores. Sample scores are drawn from the mapped scores and used in conjunction with the PCs to generate sample data.
Design tool - example
This app generates example stochastic internal loads for input into Building Energy Simulation packages.
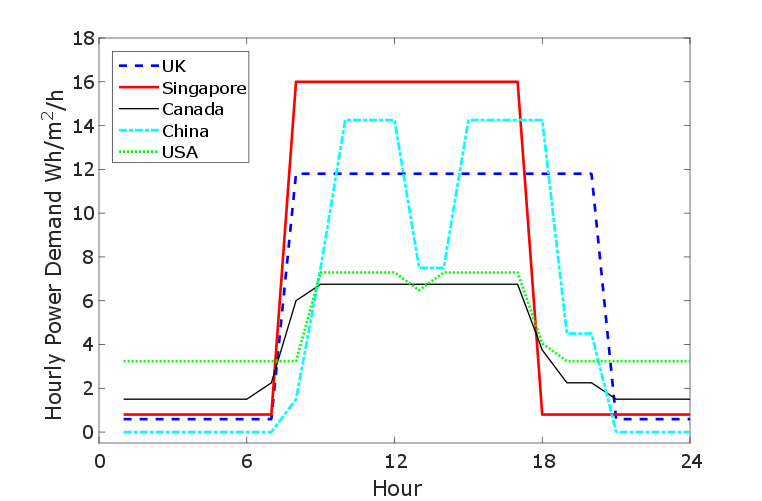
The required input is an estimate of the median expected hourly base load and load range (in units of Wh/m²/h), together with an estimate of the expected variability of the data on a scale of 1 to 4, where 1 corresponds to fairly regular demand and 4 corresponds to highly variable demand.
Clicking on ‘Submit’ will generate an hourly time history of demand for a period of 1 year, with weekends and bank holidays corresponding to the year 2019. This can be downloaded as the file ‘SampleData.csv’ by clicking on the ‘Download’ button.
What next?
A potential alternative to the activity-based deterministic approach would be to use an approach similar to that used for the specification of weather data - another stochastic input. In future, one could create annual hourly stochastic samples of typical demand according to the expected variability. These would be used with user-defined energy use intensities with scenarios for extreme demand in much the same way that typical and future weather scenarios are modelled. The methodology presented here is one way to generate annual hourly stochastic sample data and provides an initial step towards the specification of typical load profiles.
Team
This work has resulted from the PhD studies of Dr Rebecca Ward, supervised by Dr Ruchi Choudhary and funded by Laing O’Rourke and EPSRC